Log in
Sign up for FREE
arrow_back
Library
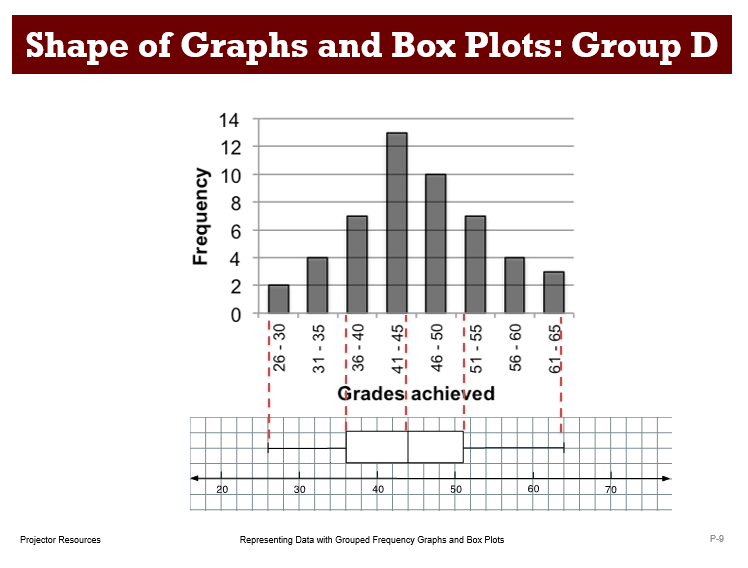
Representing Data With Grouped Frequency Graphs and Box Plots
By Formative Library
star
star
star
star
star
Share
share
Last updated about 1 year ago
5 questions
Add this activity
1
6.SP.1
6.SP.2
…
+6
1
6.SP.1
6.SP.2
…
+6
1
6.SP.1
6.SP.2
…
+6
1
6.SP.1
6.SP.2
…
+6
1
6.SP.1
6.SP.2
…
+6
Question 1
1.
Question 2
2.
Question 3
3.
Question 4
4.
Question 5
5.
Source: Mathematics Assessment Reource Service (Download for free at https://www.map.mathshell.org/lessons.php)