6.6.B.11 -Describing Distributions Using the Mean and MAD – Exit Ticket
star
star
star
star
star
Last updated almost 4 years ago
3 questions
10
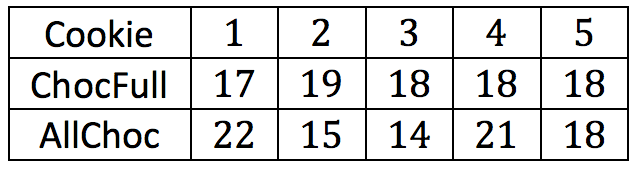
Draw a dot plot for each set of data that shows the distribution of number of
chips for each brand. Use a scale for your dot plots that covers the same span
for both distributions.
Draw a dot plot for each set of data that shows the distribution of number of
chips for each brand. Use a scale for your dot plots that covers the same span
for both distributions.
10
Find the mean number of chocolate chips for each of the two brands. Compare the
means.
Find the mean number of chocolate chips for each of the two brands. Compare the
means.
10
Looking at your dot plots and considering variability, which brand do you
prefer? Explain your reasoning.
Looking at your dot plots and considering variability, which brand do you
prefer? Explain your reasoning.